As a financial or Investment Analyst, there are many times when you need to perform valuations or analysis on competitor's results. If you are lucky, you may get the data in excel, but most times, you only get useful data in PDF, in the form of the competitor's financial statements. The challenge then is how to transfer data contained in the Income statement, Balance Sheet, CashFlow Statement and other sections to excel in such a way that it maintains data in an orderly manner with each year's performance copied to separate columns as seen in the PDF sheet.
If you try to copy and paste directly from the PDF file using Ctrl + C and Ctrl + V respectively, you get all the data pasted into a single cell, and that is of no use to you as you would need to do some heavy copying and organizing to get the same format as seen in the PDF file. In today's post we would take you through a much faster and easier way to get your tabular like data in PDF quickly copied to excel in order to skip the laborious task of formatting each cell and get started on your analysis instead. Let's begin.
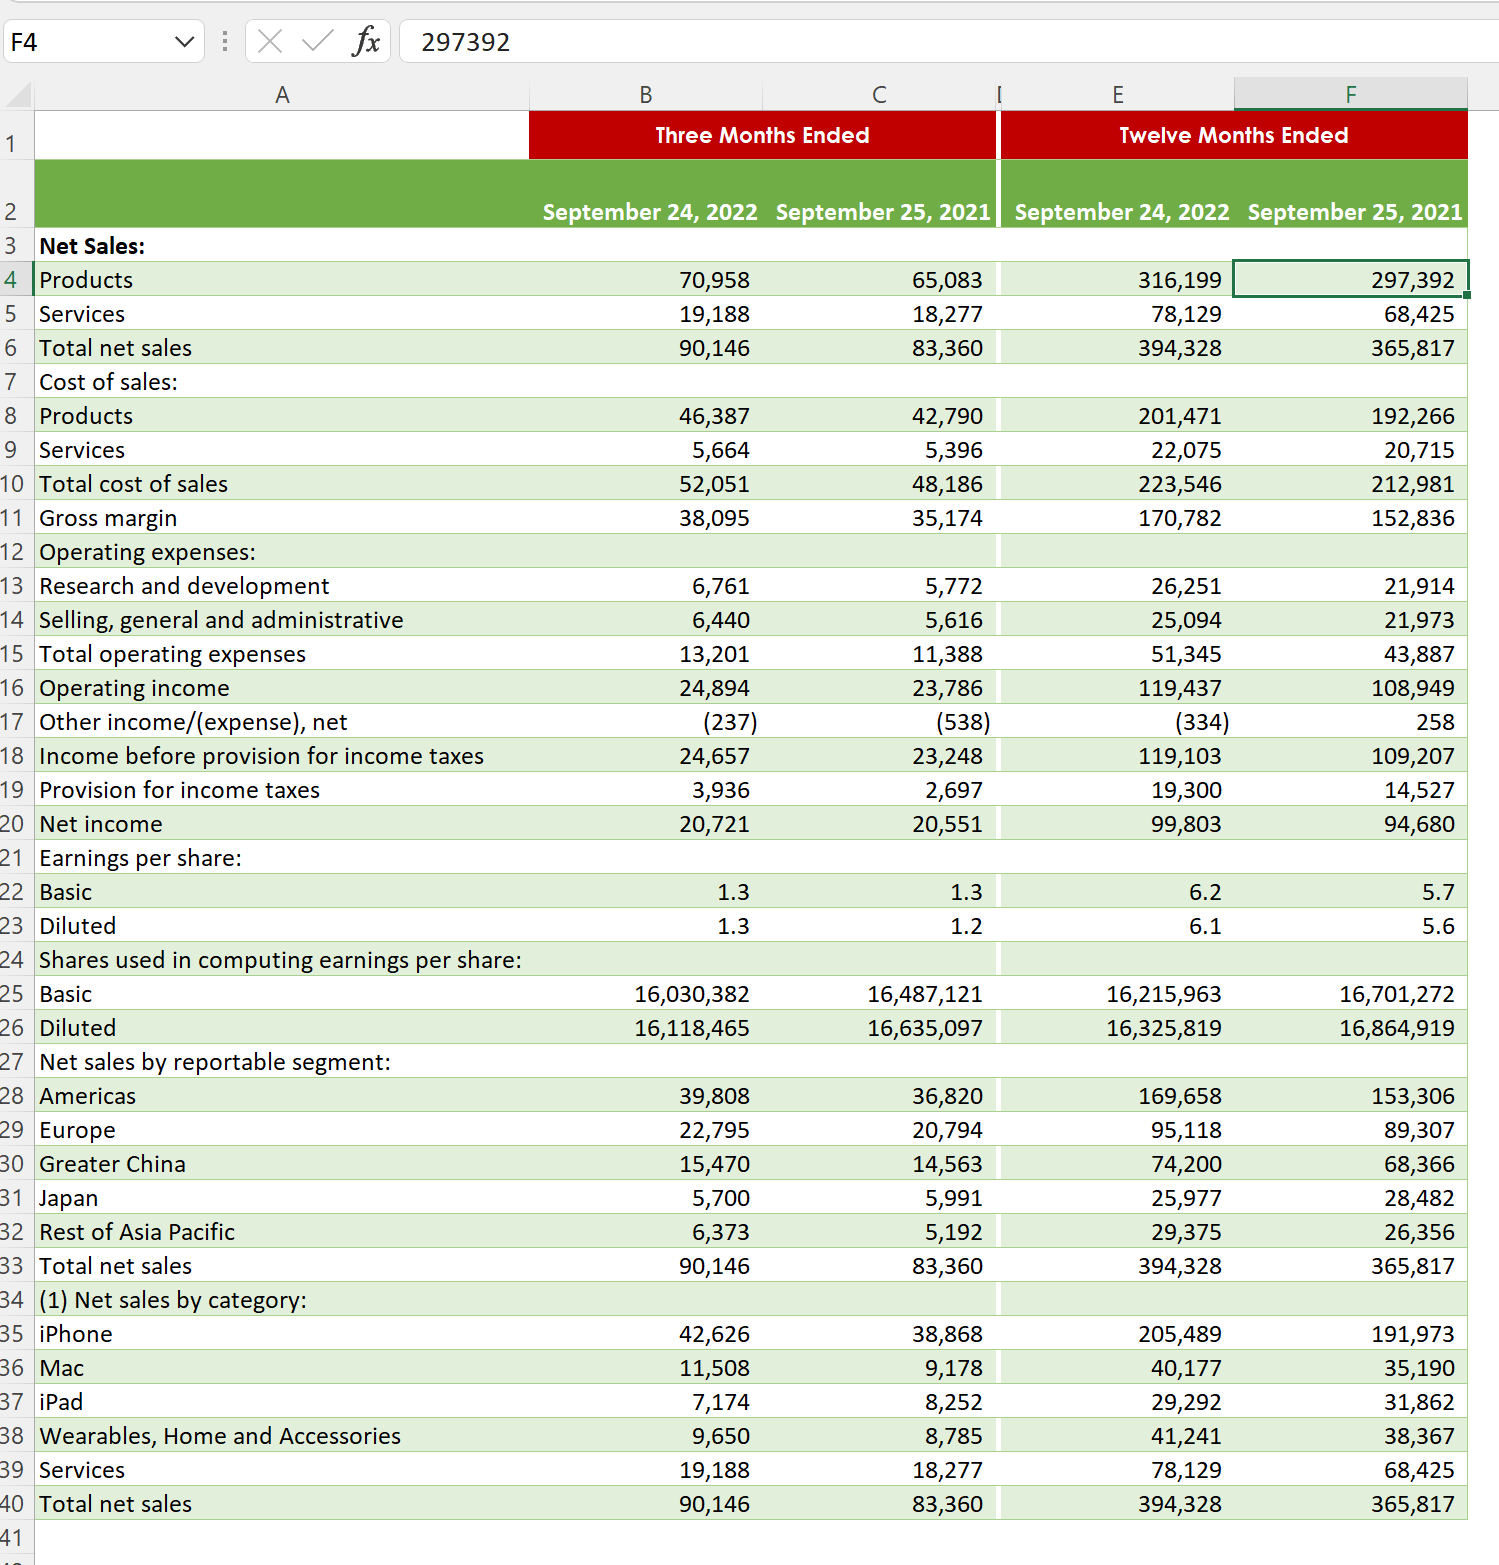
For our example today, we would be copying the fourth quarter financial summary of Apple to excel. The report says year ended September and still calls it Q4 financial summary. Typically, the fiscal period for most companies is from the 1st January - 31st December. However, this isn't the case for Apple and some other popular companies. Apple's fiscal period is usually from the last week of September the previous year to the last week of September the following year. For instance, the fiscal period for 2022 was from 26th September 2021 to 24th September 2022. Not like any of it matters for the purpose of this tutorial, but just to explain why it may look strange for those familiar with financial statement terminologies and reporting periods.
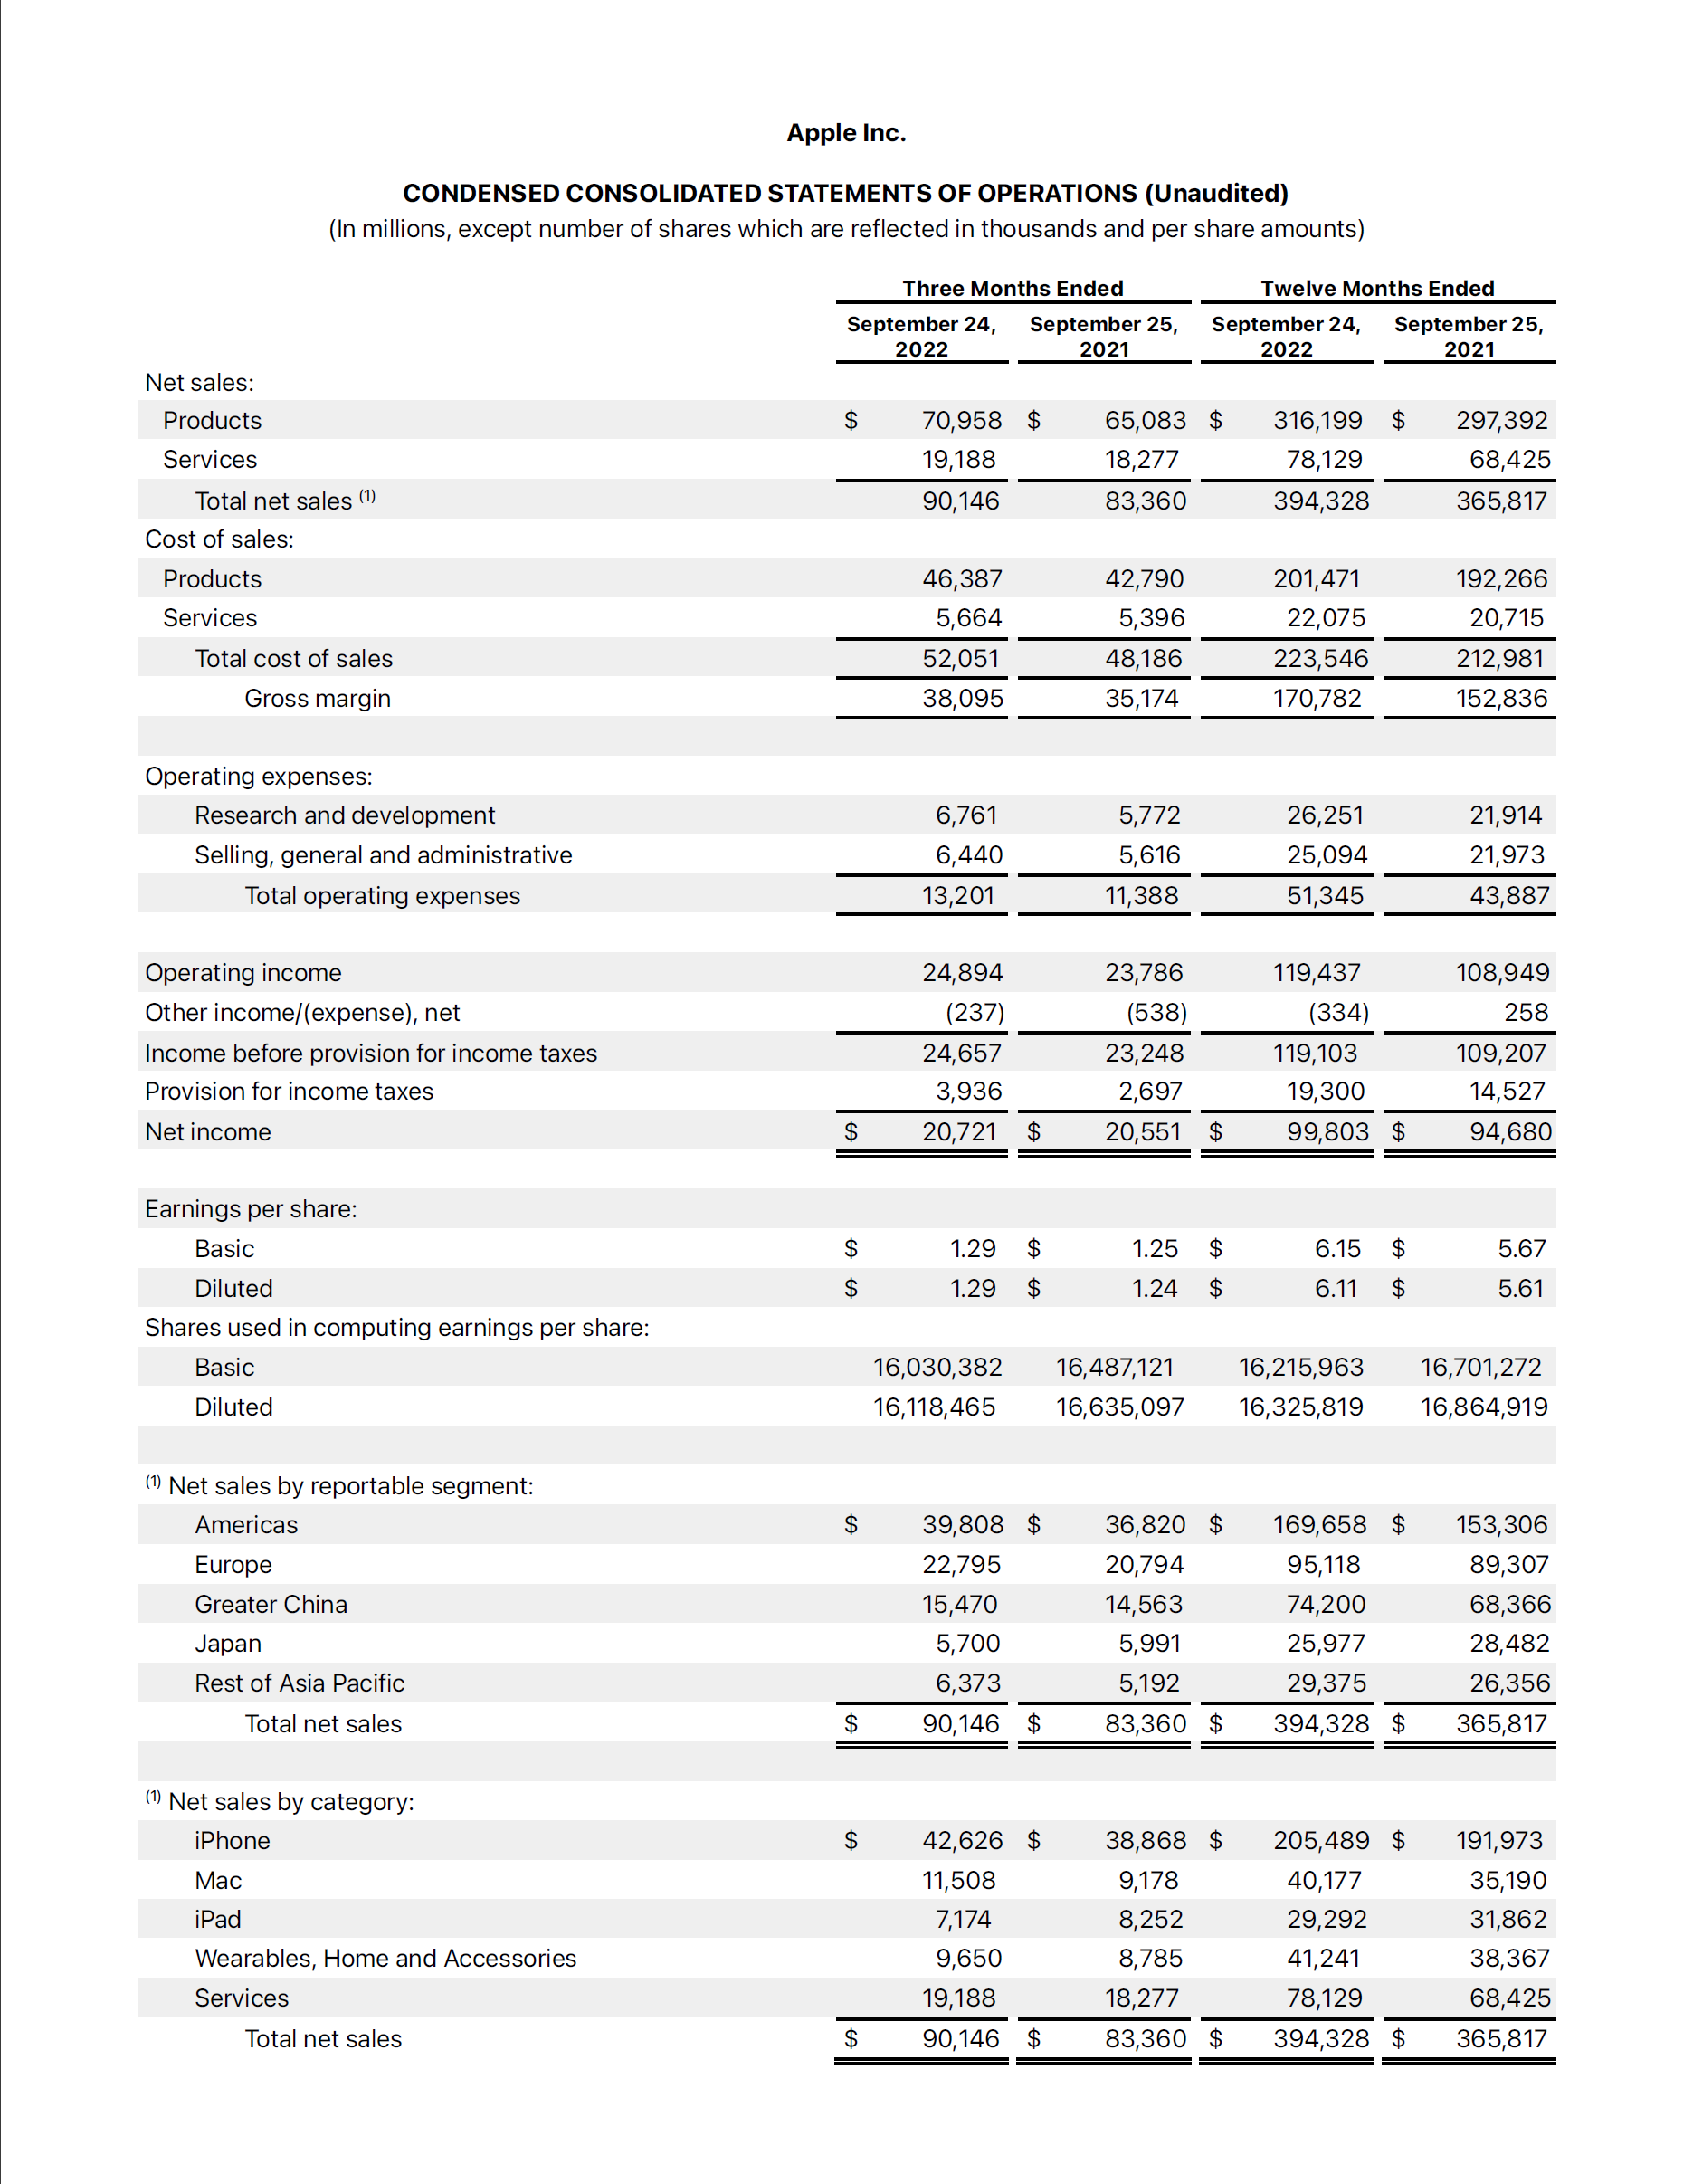
Follow the steps below to copy the data:
Step 1: Open the pdf document with Google chrome or Microsoft Edge and copy the url

Step 2: Open excel and select data
Step 3: Click on the Get Data dropdown, then other sources, and finally select from the web
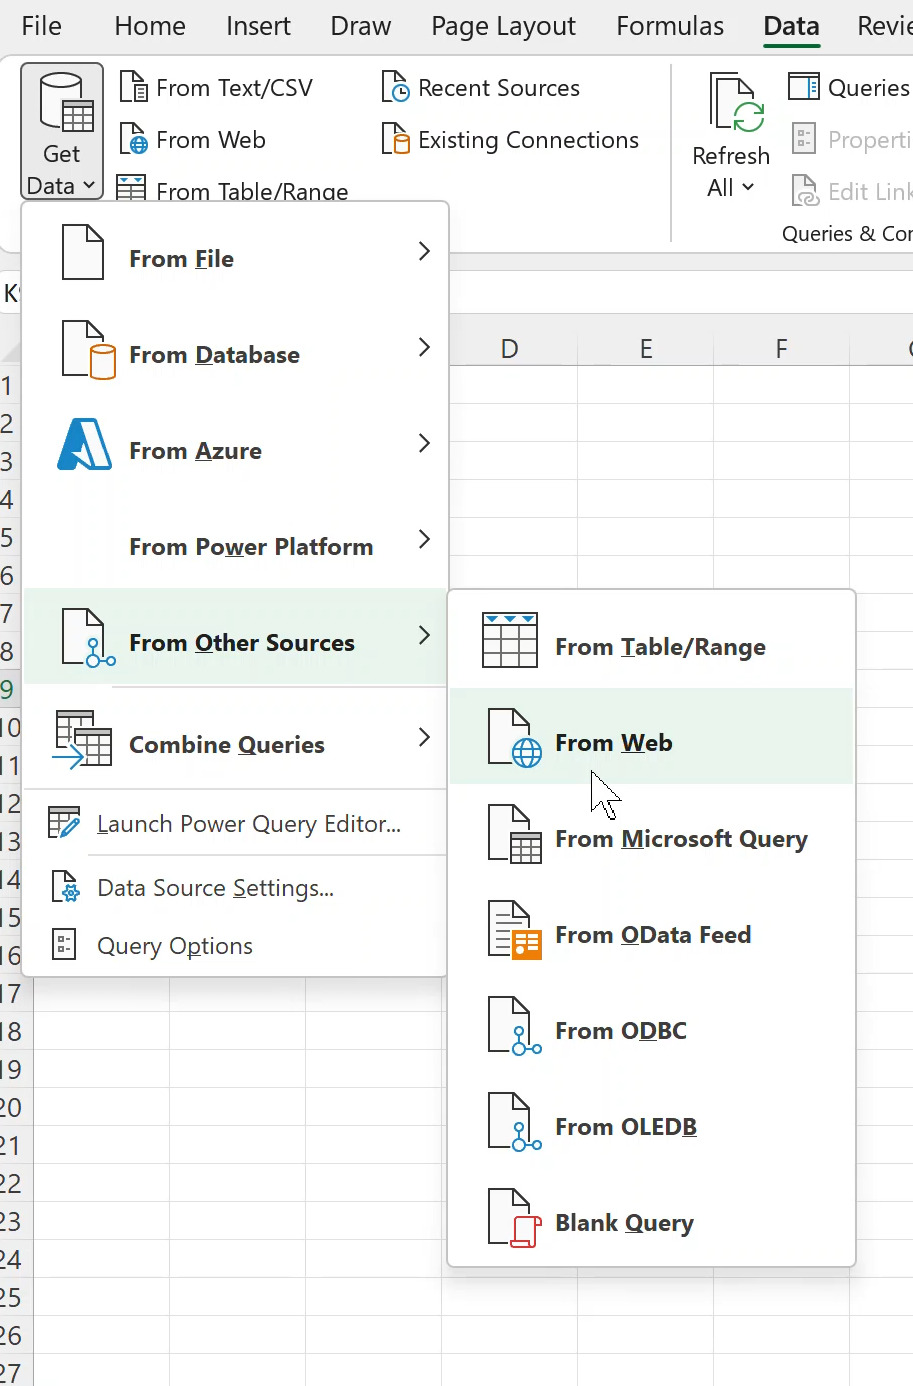
Step 4: Paste the link you copied in step 1 into the pop out box

Step 5: Excel pops out a Navigator box where you can preview and select the tables you want to populate into excel. Select the table you need and click on load
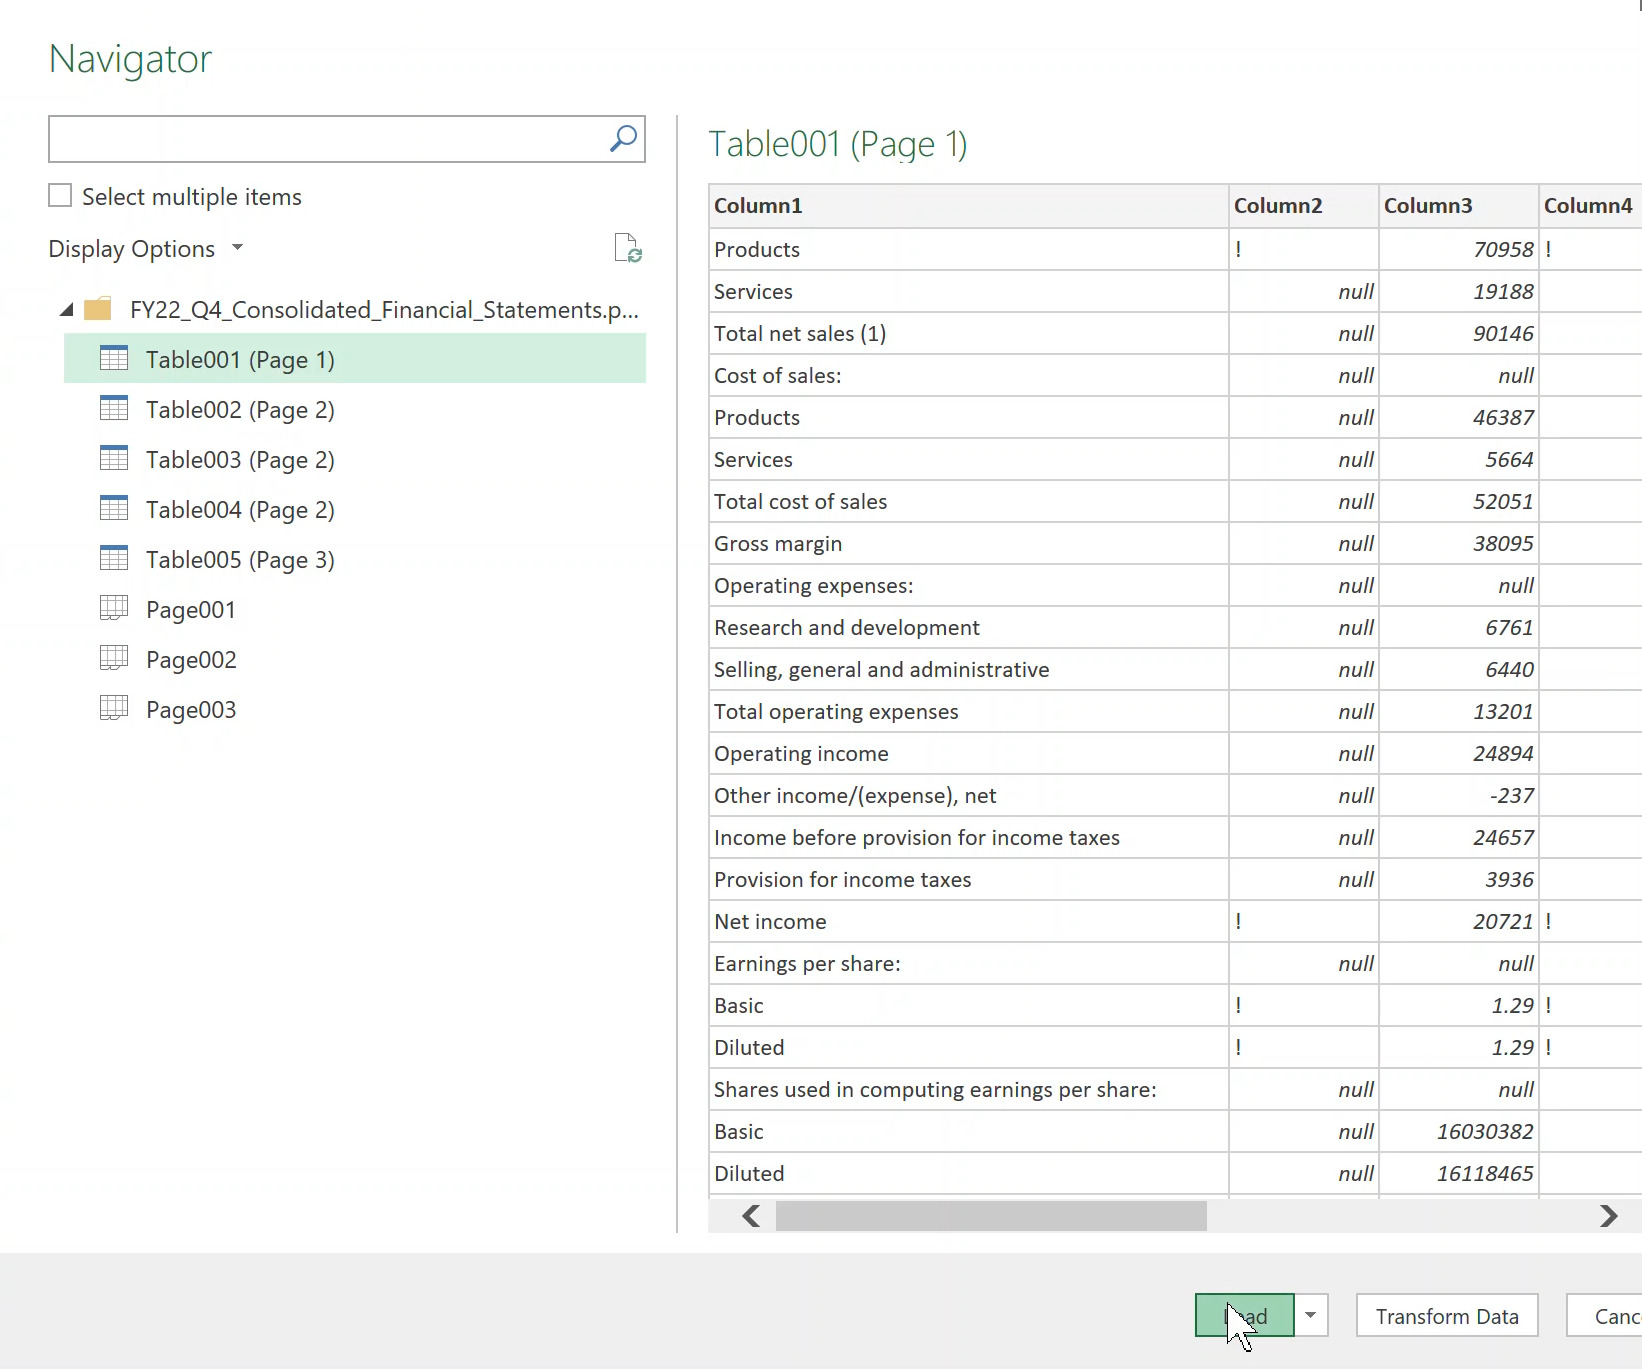
Step 6: No further steps, all you need to do is a little formatting and Khalas, all done.
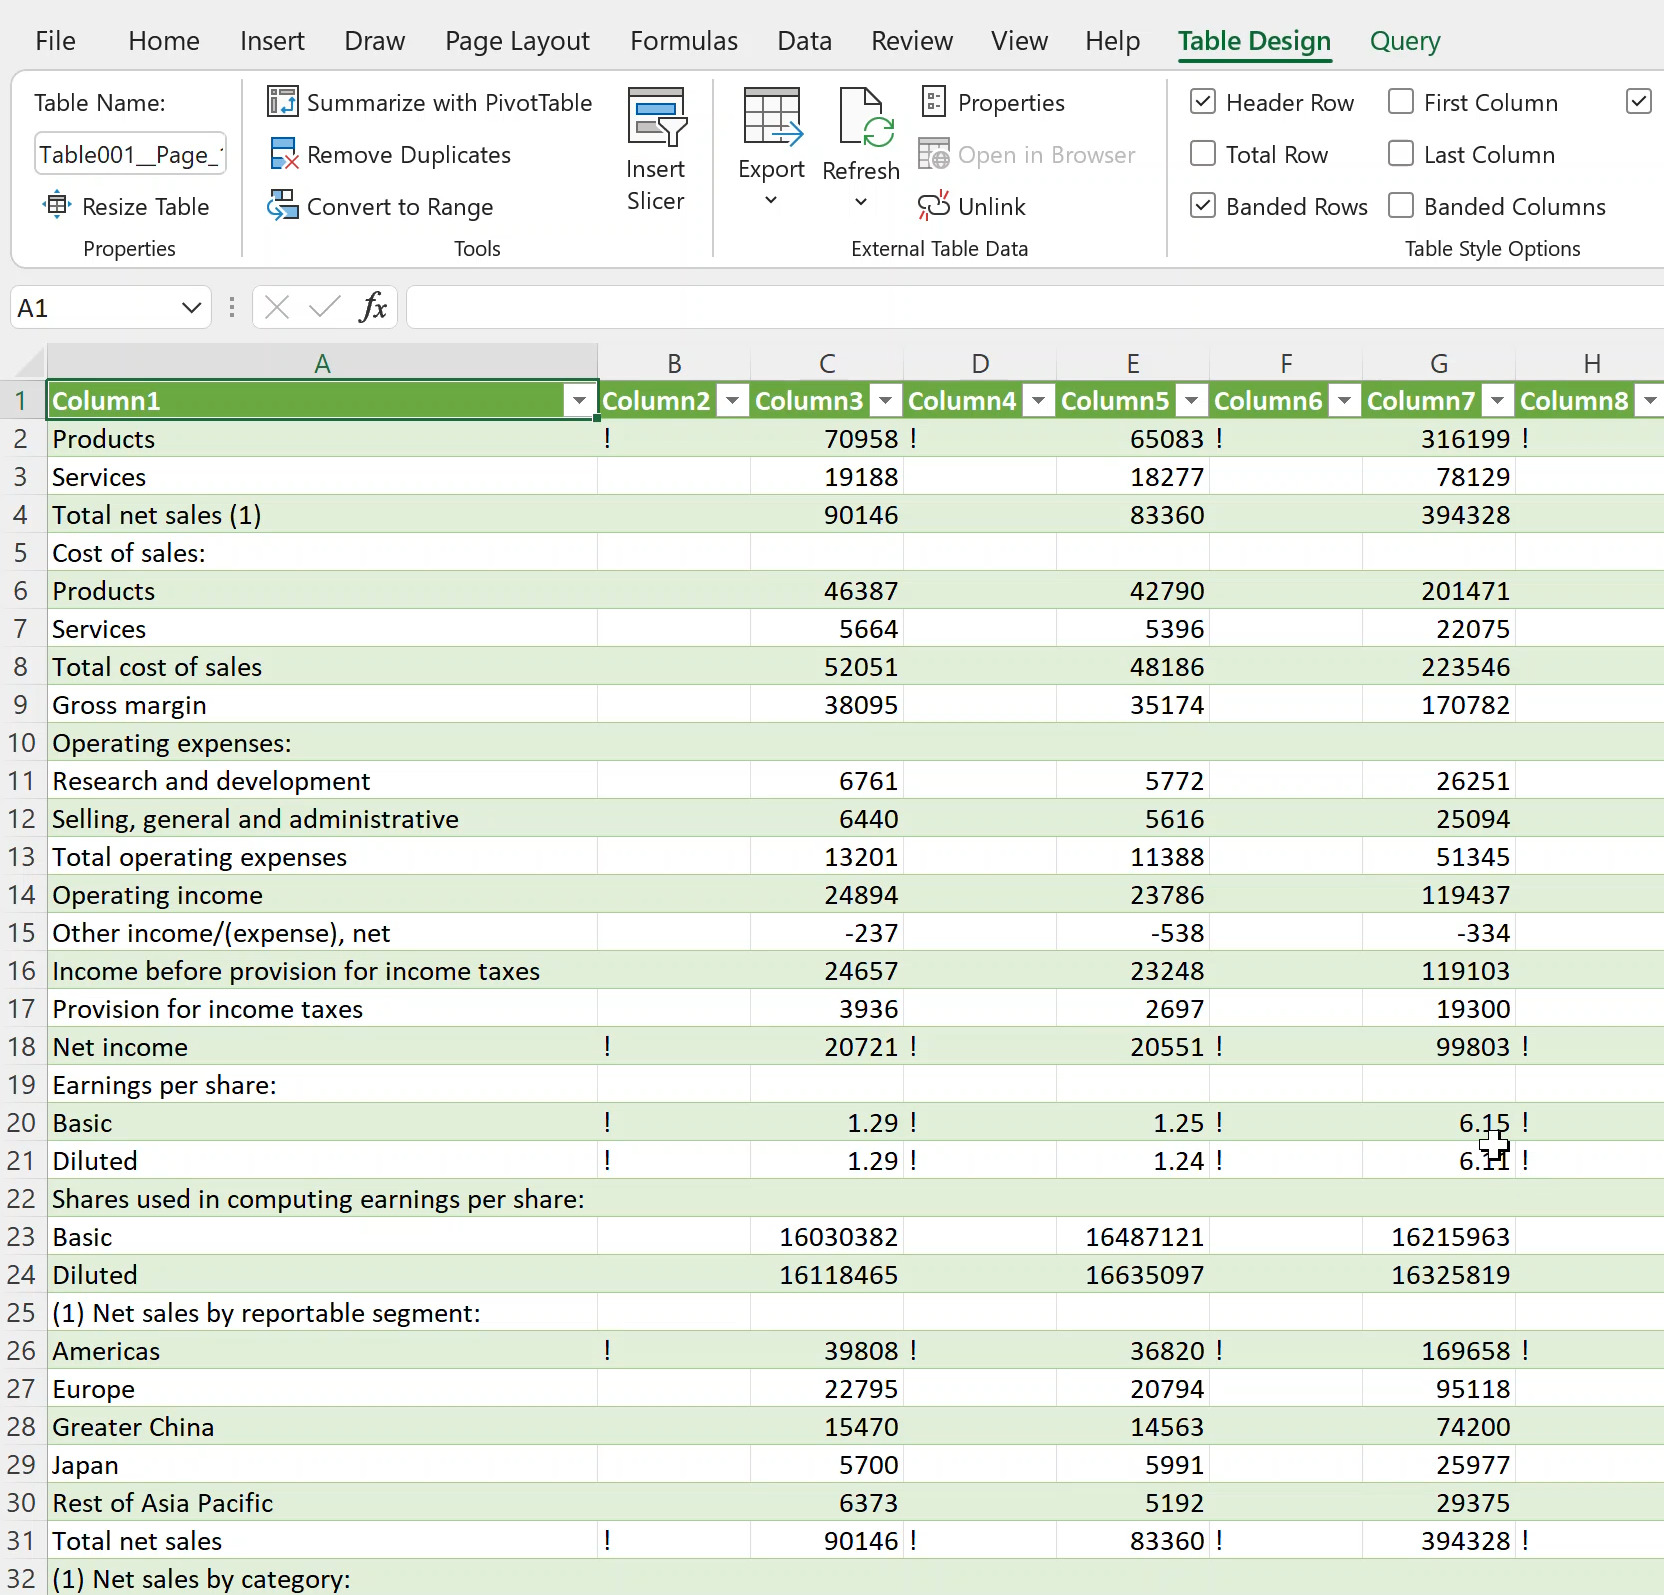
Like we said above, just change the headings and convert to range and it is easier to relate to the original PDF document. You can also edit the color formatting if you have the time. However, the main purpose is to get those figures into excel so you can proceed with your analysis.
